Antimicrobial Use Data
Antimicrobial Stewardship Dashboard
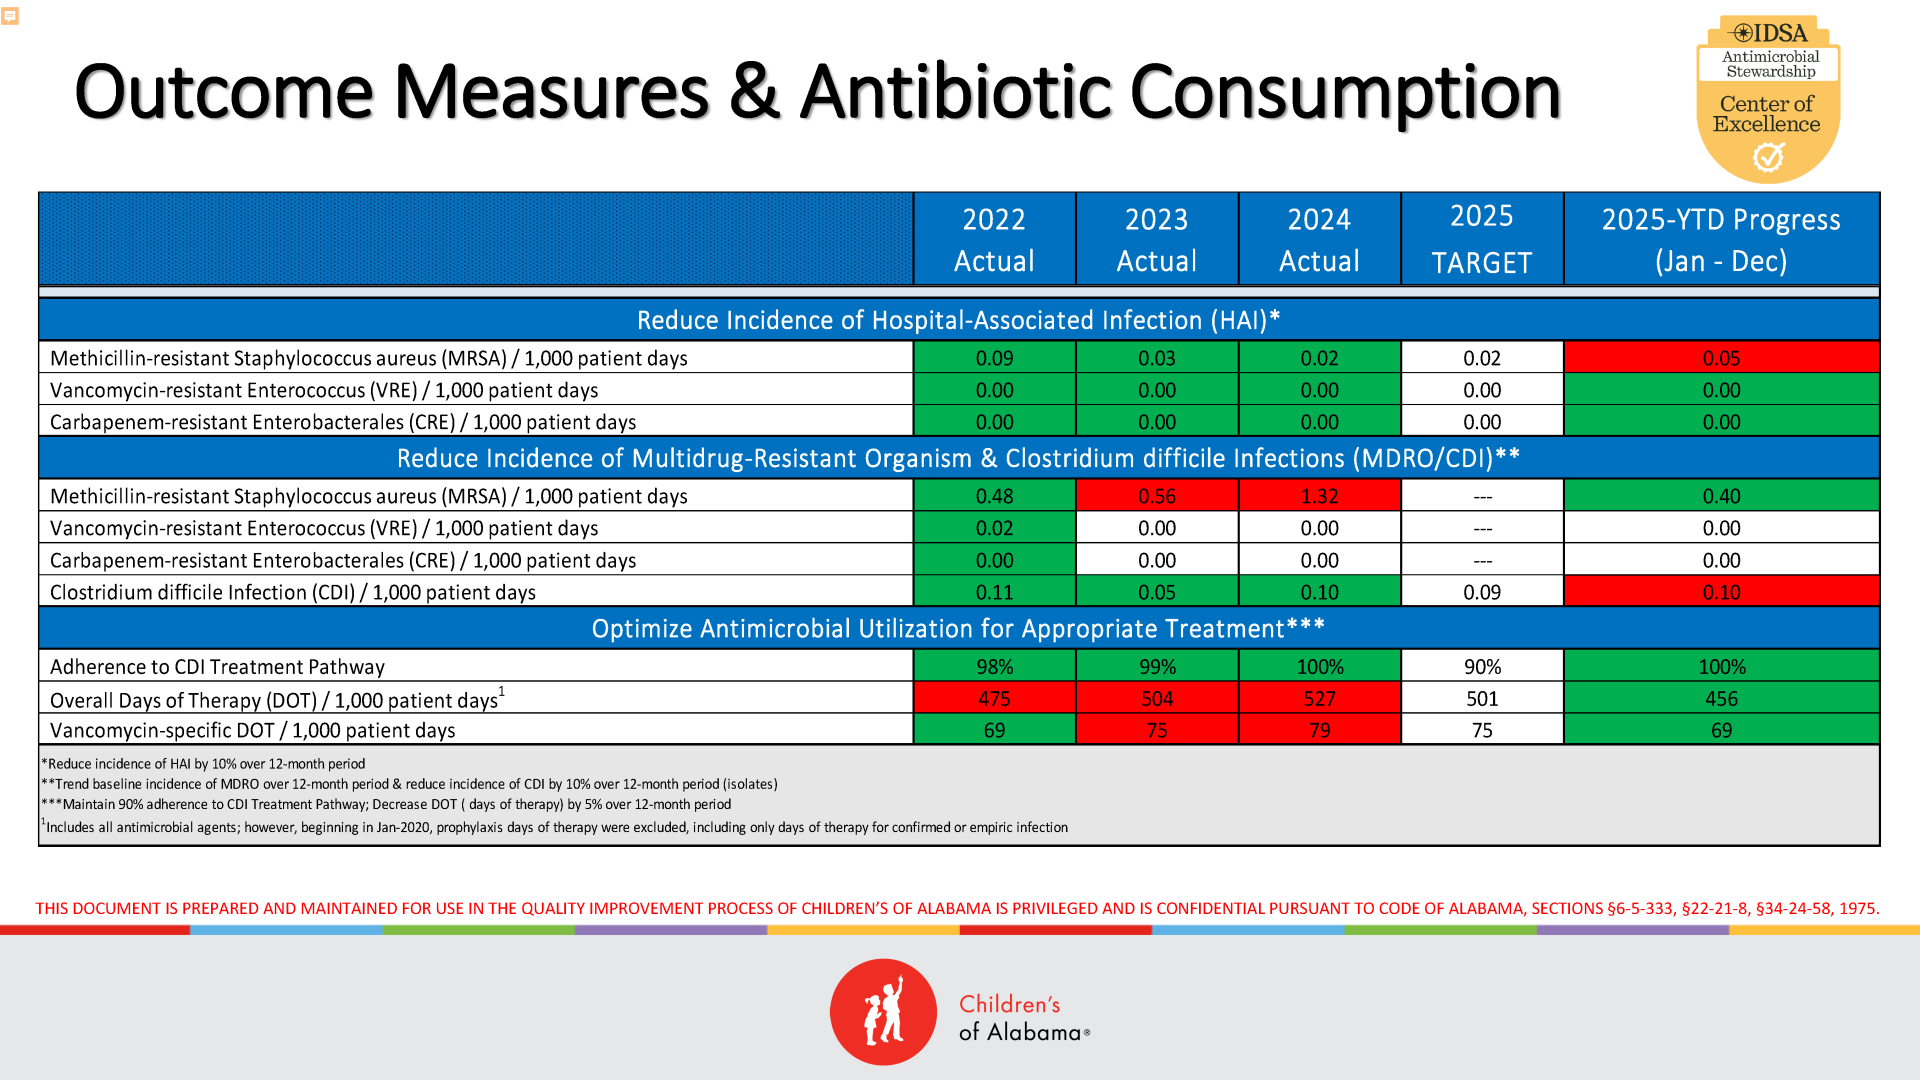
This dashboard highlights how Children’s of Alabama is performing in preventing infections and using antibiotics responsibly. It tracks key measures such as infection rates and antibiotic use over time, comparing past performance with current progress toward annual goals. The color indicators make it easy to see where we are meeting targets and where opportunities remain. By monitoring both outcomes and antibiotic use together, we ensure that efforts to reduce infections are balanced with safe, appropriate treatments, supporting better patient outcomes and safer care.
Antimicrobial Review Run Chart (Year-end only)
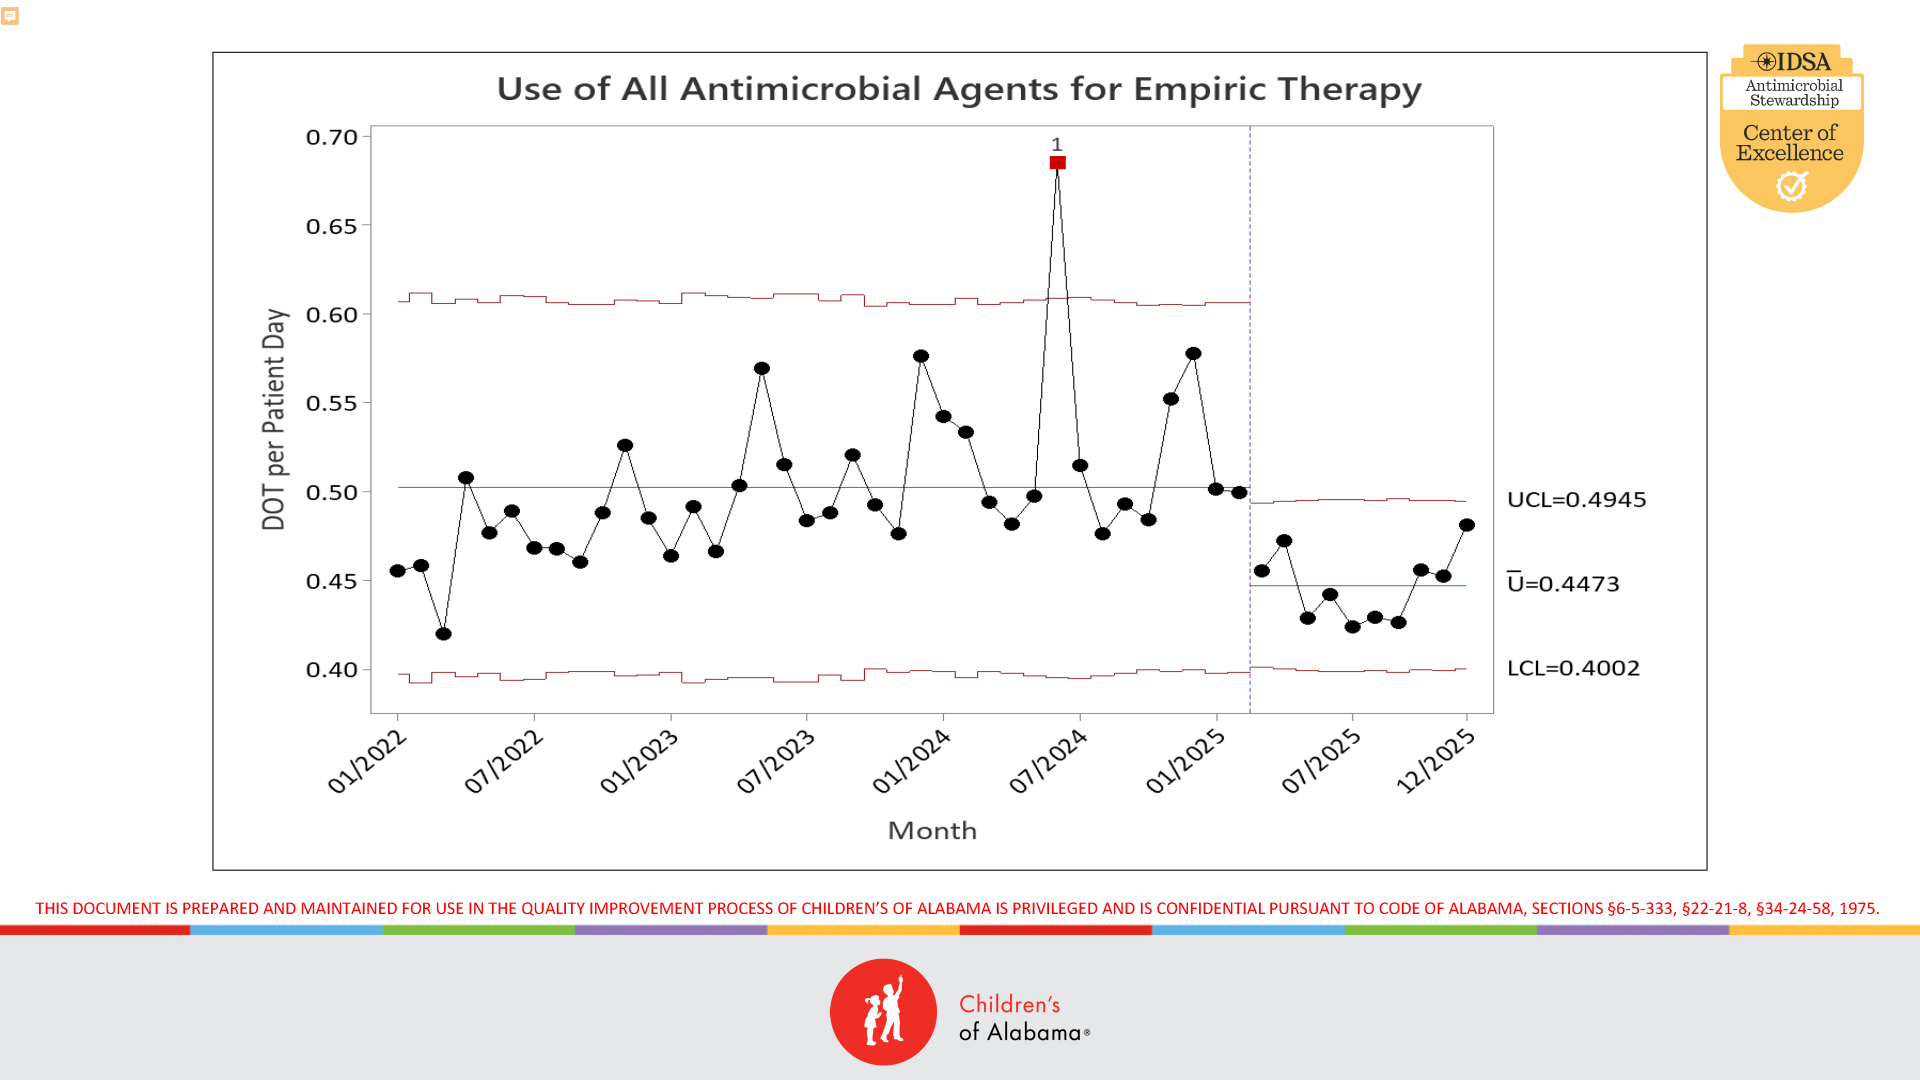
This chart shows how antibiotic use changes month to month across the hospital. Each point represents a single month, while the center line reflects the overall average, and the surrounding lines show the expected range of normal variation. When patterns shift beyond what would be expected by chance, it signals meaningful improvement. Recent data demonstrate a sustained decrease in antibiotic use, indicating that stewardship efforts are having a real and positive impact on patient care and safety.